Weekly k6 Benchmarks in CI: OAuth2 Trend Detection
Weekly k6 Benchmarks in CI: Automated Performance Trend Detection for OAuth2 Servers
Performance bugs are the kind of bugs that don’t throw exceptions. They creep in through an innocent dependency bump, a subtle query regression, or a new feature that adds 2ms to your hot path. By the time anyone notices, the degradation has been baked into a dozen releases and nobody knows which commit caused it.
The fix is not “test harder before release.” The fix is continuous performance measurement with trend awareness — and GitHub Actions makes this surprisingly practical.
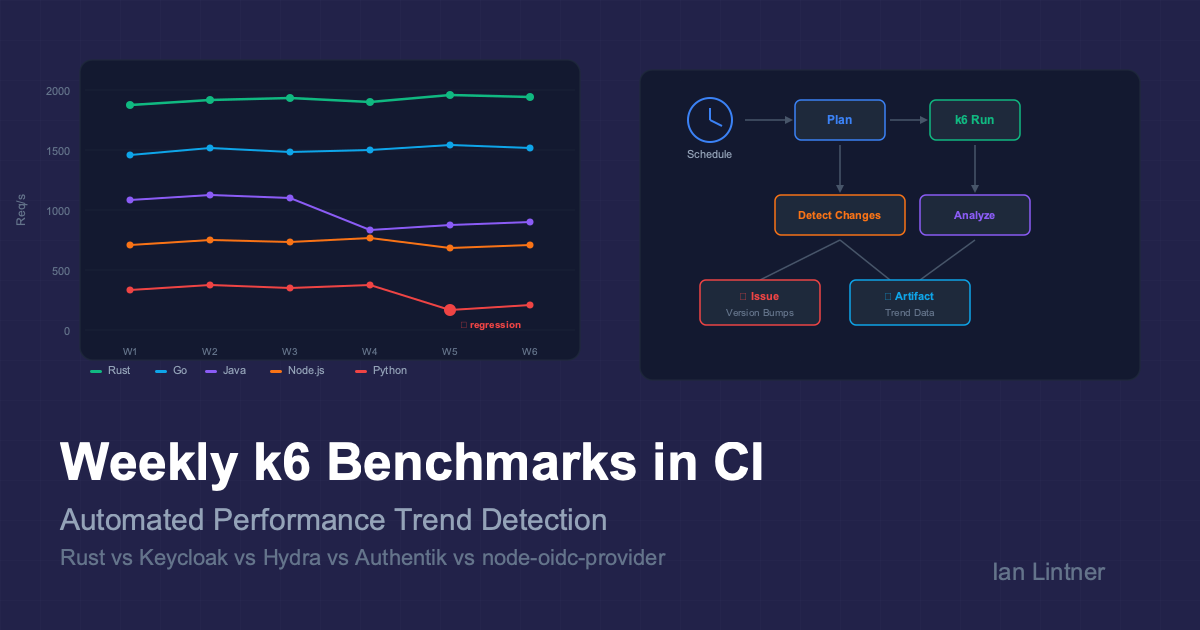
This post breaks down the Weekly Benchmarks workflow from the rust-oauth2-server project: a CI-native system that load-tests a Rust OAuth2 server against four major open-source alternatives (Keycloak, Ory Hydra, Authentik, and node-oidc-provider) every week, detects performance regressions, and creates follow-up issues automatically.
🎯 TL;DR
| What | How |
|---|---|
| Tool | k6 (Grafana) — Go-based load generator with JS test scripts |
| Servers | Rust, Rust+Mongo, Keycloak (Java), Ory Hydra (Go), Authentik (Python), node-oidc-provider (Node.js) |
| Scenarios | client-credentials, token-introspect, discovery, health |
| Schedule | Every Monday 03:17 UTC, plus manual dispatch |
| Intelligence | Git-aware planner auto-selects which servers to re-benchmark based on what changed |
| Output | Comparison report, CSV export, Mermaid throughput charts, CI manifest, GitHub Issues for version bumps |
🏗️ Why Weekly Benchmarks in CI?
Most teams benchmark reactively: someone reports “the API feels slow,” and an engineer spends a day reproducing it on a laptop. The numbers are unreproducible because the laptop was running Slack, Docker Desktop, and 47 Chrome tabs.
A scheduled CI benchmark solves several problems at once:
- Consistent environment — same runner hardware, same Docker resource limits, same network topology every week.
- Historical trend line — you can compare this week’s numbers to last week’s, last month’s, and the baseline from when the project was “fast.”
- Automated regression detection — if a Rust server’s p99 latency jumps 40% after a dependency update, the workflow artifact tells you which run introduced it.
- Cross-server comparison — benchmarking against Keycloak, Hydra, Authentik, and node-oidc isn’t just for bragging rights. It validates that your server’s performance ratios haven’t shifted — if your Rust server was 3x faster than Keycloak and now it’s 1.5x, something regressed.
The honesty caveat
The workflow itself documents its own limitations:
“GitHub-hosted runners are good for directional trend checks, not lab-grade benchmark reproducibility.”
This is the right framing. CI benchmarks are a smoke detector, not a calibration lab. You’re looking for relative changes and trend breaks, not absolute throughput numbers you’d put in a sales deck.
🧠 The Smart Planner: Git-Aware Server Selection
This is the most technically interesting piece. The workflow doesn’t blindly re-run all six servers every week. It uses a planner (plan_benchmark_run.sh) that inspects the last 7 days of commits on main and decides which servers actually need re-benchmarking.
flowchart TD
    A["Cron Trigger\n(Monday 03:17 UTC)"] --> B["Fetch 7 days of commits"]
    B --> C{"Any commits\non main?"}
    C -->|No| D["Skip run\n(save CI minutes)"]
    C -->|Yes| E["Classify changed files"]
    E --> F{"First-party\ncode changed?"}
    E --> G{"Third-party\nversion bumped?"}
    F -->|Yes| H["Select rust + rust-mongo"]
    G -->|Yes| I["Select bumped server\n+ rust baseline"]
    G -->|Yes| J["Create GitHub Issue\nfor version reconciliation"]
    F -->|No| K{"Force flag\nor manual?"}
    K -->|Yes| H
    K -->|No| L{"Only docs/CI\nchanges?"}
    L -->|Yes| D
    H --> M["Run k6 benchmarks"]
    I --> M
Change classification rules
The planner categorizes every changed file:
| File pattern | Classification | Servers selected |
|---|---|---|
src/*, crates/*, Cargo.toml, Cargo.lock, Dockerfile* | First-party runtime change | rust, rust-mongo |
benchmarks/k6/*, benchmarks/setup/*, benchmarks/run-benchmarks.sh | Benchmark harness change | rust, rust-mongo |
benchmarks/docker-compose.yml (Keycloak image tag change) | Third-party version bump | keycloak + rust baseline |
Docs, README, .github/* (non-benchmark) | No benchmark impact | Skip entirely |
The version bump detection is particularly clever. For each third-party server, the planner:
- Extracts the current pinned version from
docker-compose.yml(orpackage.jsonfor node-oidc). - Extracts the previous version from the same file at the
base_sha(the commit 7 days ago). - If they differ, it flags that server for re-benchmarking and creates a follow-up GitHub Issue assigned to Copilot.
# Simplified version extraction for Keycloak
extract_version_from_stream() {
  local server="$1"
  case "$server" in
    keycloak) sed -n "s#.*quay.io/keycloak/keycloak:\([^[:space:]]*\).*#\1#p" | head -n1 ;;
    hydra)    sed -n "s#.*oryd/hydra:\([^[:space:]]*\).*#\1#p" | head -n1 ;;
    # ...
  esac
}
Why this matters for QA
Traditional QA approaches treat performance testing as a phase — you do it before a release. The planner inverts this: performance testing happens in response to change, on a weekly cadence. If nothing changed that could affect performance, the workflow skips entirely (saving CI minutes). If a third-party dependency bumped, the workflow re-runs just that server plus your baseline.
This is shift-left for performance, but with the intelligence to not waste resources on irrelevant runs.
🧪 The k6 Test Harness: Apples-to-Apples Load Testing
Why k6?
k6 is a load testing tool written in Go with JavaScript test scripts. It’s an excellent fit for CI because:
- No JVM warmup in the test tool — unlike JMeter or Gatling, k6 itself doesn’t introduce measurement artifacts from its own runtime.
- Structured JSON output — every request is logged with timing data, tags, and metadata, making post-hoc analysis trivial.
- Docker-native —
grafana/k6:0.50.0runs as a container on the same Docker network as the servers under test. - Custom metrics — k6 lets you define
RateandTrendmetrics alongside the built-in HTTP metrics, so you can track domain-specific things liketoken_successrate.
Scenario design
The benchmark suite runs four scenarios against each server:
flowchart LR
    subgraph Scenarios
        A["client-credentials\nPOST /oauth/token"] --> |"JWT signing\nclient auth\nDB write"| M["Core OAuth2\nworkload"]
        B["token-introspect\nPOST /oauth/introspect"] --> |"Token lookup\nDB read\nvalidation"| M
        C["discovery\nGET /.well-known/..."] --> |"JSON serialization\ncache behavior"| M
        D["health\nGET /health"] --> |"Baseline HTTP\noverhead"| M
    end
The client credentials scenario is the primary benchmark because it exercises the full OAuth2 token issuance path (client authentication, JWT signing, token persistence) in a single HTTP POST — no browser interaction, no redirects, no user session state. It’s the closest thing to an “apples-to-apples” comparison across servers that have very different architectures.
Fair comparison controls
This is where the harness gets serious about fairness:
| Control | Implementation |
|---|---|
| CPU/memory limits | Every server gets exactly 2 CPU cores and 512MB RAM via Docker deploy.resources.limits |
| Same database | All SQL-backed servers share a PostgreSQL 16 instance (separate databases) |
| Sequential execution | Only one server runs at a time — no resource contention |
| Multiple iterations | Each scenario runs 3 times; results are averaged to smooth runner variance |
| JVM warmup | Java-based servers (Keycloak) get warmup requests before measurement begins |
| Same client config | Identical client_id, client_secret, and scope across all servers |
| Same network | All containers on a single Docker bridge network |
The resource limits are particularly important. Without them, Keycloak (Java) would happily consume 2GB of RAM and look great, while Rust’s 30MB footprint would be an unfair advantage in a different way. By capping everyone at 512MB, you’re testing “how well does this server perform under realistic, constrained conditions?”
Load profiles
const profiles = {
  light: [
    { duration: "15s", target: 10 }, // ramp up
    { duration: "30s", target: 50 }, // steady state
    { duration: "15s", target: 50 }, // hold
    { duration: "10s", target: 0 }, // ramp down
  ],
  medium: [
    { duration: "15s", target: 50 },
    { duration: "30s", target: 200 },
    { duration: "30s", target: 200 },
    { duration: "15s", target: 0 },
  ],
  heavy: [
    { duration: "20s", target: 100 },
    { duration: "30s", target: 500 },
    { duration: "60s", target: 500 },
    { duration: "20s", target: 0 },
  ],
};
The weekly cron runs light by default (10→50 VUs over 70 seconds). Manual dispatch can escalate to medium or heavy to validate scaling behavior. The ramp-up / steady-state / ramp-down pattern is critical — it lets you observe how each server handles increasing load, not just steady-state throughput.
📊 Results Analysis and Trend Detection
After k6 finishes, analyze-results.sh parses the JSON summaries and generates:
- A Markdown comparison report with per-scenario tables (req/s, avg/median/p95/p99 latency, error rate)
- Visual bar charts (ASCII/Unicode) showing relative throughput and latency
- Mermaid pie charts showing throughput share per scenario
- A performance multiplier table — “how does each server compare to the Rust baseline?”
- CSV export for external analysis
The metrics that matter for trend detection
The analysis captures six key metrics per server per scenario:
| Metric | What it tells you | Trend signal |
|---|---|---|
| Req/s | Raw throughput | Week-over-week drop = regression |
| Avg latency | Mean response time | Gradual increase = creeping degradation |
| p95 latency | Tail performance | Spike = new contention point |
| p99 latency | Worst-case behavior | Sudden jump = new code path hitting edge case |
| Error rate | Reliability under load | Any increase = functional regression |
| Throughput ratio vs baseline | Relative positioning | Ratio change = server-specific regression |
The throughput ratio is the most powerful trend signal. If your Rust server typically handles 4x the requests of Keycloak for client-credentials, and that ratio drops to 2.5x, you know the regression is in your code — not environmental noise. Environmental noise affects all servers equally.
CI manifest for traceability
Every run writes a ci-run-manifest.json that captures:
{
  "generated_at": "2026-04-08T12:30:34Z",
  "event_name": "workflow_dispatch",
  "since_date": "2026-04-01T12:30:34Z",
  "recent_commit_count": 5,
  "selected_servers": ["rust", "rust-mongo"],
  "profile": "light",
  "scenarios": [
    "client-credentials",
    "token-introspect",
    "discovery",
    "health"
  ],
  "iterations": 1,
  "github_run_id": "24135411134",
  "github_sha": "455c3491241395664c1d6c116af9d28c8c7a1682"
}
This is your audit trail. When you’re investigating a regression three months from now, you can look at the manifest to see exactly what was tested, which servers were selected, what the commit SHA was, and how many commits had landed since the last run.
🔄 The Full Pipeline: From Cron to Issue
sequenceDiagram
    participant Cron as ⏰ Cron (Monday)
    participant Plan as 📋 Planner
    participant Git as 🔀 Git History
    participant k6 as 🏋️ k6 Load Gen
    participant Servers as 🖥️ OAuth2 Servers
    participant Analyze as 📊 Analyzer
    participant GH as 🎫 GitHub Issues
    participant Art as 📦 Artifacts

    Cron->>Plan: Trigger weekly run
    Plan->>Git: Fetch 7 days of commits
    Git-->>Plan: Changed files + versions
    Plan->>Plan: Classify changes
    Plan->>Plan: Select servers

    alt Version bump detected
        Plan->>GH: Create follow-up issue
        GH-->>Plan: Issue #N assigned to copilot
    end

    Plan->>k6: Start benchmark (selected servers)

    loop For each selected server
        k6->>Servers: Warmup requests
        k6->>Servers: Load test (3 iterations)
        Servers-->>k6: Response metrics
    end

    k6->>Analyze: Raw JSON results
    Analyze->>Analyze: Compute averages, ratios
    Analyze->>Art: Upload comparison report + CSV + manifest
The version bump issue workflow
When the planner detects that a third-party server’s pinned version changed (say Keycloak went from 24.0 to 25.0), it doesn’t just re-run benchmarks. It also creates a GitHub Issue with:
- Which versions changed and in which direction
- A checklist of follow-up tasks (review compatibility, refresh baselines, update docs)
- Assignment to
copilotfor automated triage
This closes the loop between “something changed” and “someone needs to act on it.”
🤔 What Makes This Technically Interesting
1. Partial runs with baseline reuse
Most benchmark CI setups are all-or-nothing: run everything or nothing. This workflow introduces partial runs with baseline reuse. If only the Rust server changed, the workflow runs k6 against rust and rust-mongo, then merges those fresh results with the checked-in baseline files for Keycloak, Hydra, Authentik, and node-oidc that already exist in benchmarks/results/.
The result: a merged comparison artifact that covers all six servers, even though only two were actually benchmarked this week. This keeps weekly runs under 30 minutes instead of 3+ hours.
2. The cron offset trick
cron: "17 3 * * 1"
The cron fires at 03:17 UTC on Mondays, not :00. This is a deliberate choice. GitHub Actions cron scheduling is best-effort, and workflows scheduled at the top of the hour compete for runner allocation. Offsetting by 17 minutes reduces scheduler contention and makes the run more likely to start on time.
3. Language-diverse comparison as a regression control
Benchmarking Rust against Keycloak (Java), Hydra (Go), Authentik (Python), and node-oidc (Node.js) isn’t just about language comparisons. It’s a control group. If all five servers show a throughput drop in the same week, the regression is environmental (runner hardware, Docker version, PostgreSQL update). If only the Rust server drops, the regression is in your code.
This is the same principle as running a positive and negative control in a science experiment. The third-party servers are your control group.
4. Docker resource limits as an equalizer
deploy:
  resources:
    limits:
      cpus: "2"
      memory: 512M
By enforcing identical resource constraints, the benchmark measures efficiency, not capacity. A JVM-based server that needs 2GB to perform well will hit OOM or GC thrashing at 512MB — which is exactly what happens in production when you’re running multiple services on the same node. These constraints simulate a realistic, resource-constrained deployment.
5. Structured output for downstream automation
Every benchmark run produces:
- JSON summaries per server/scenario/iteration
- Raw k6 JSON stream with per-request timing data
- CSV for spreadsheet analysis
- Markdown report with Mermaid charts for PR comments
- CI manifest for audit trail
This structured output means you can build downstream automation: a Grafana dashboard that ingests the CSV, a Slack bot that posts the Markdown report, or a custom script that compares this week’s manifest to last week’s and flags regressions.
🔍 Spotting Regressions: A Practical Framework
Here’s how to use weekly benchmark data to catch performance problems before users do:
Week-over-week comparison
Week N:   Rust client-credentials → 1,850 req/s, p99 = 12ms
Week N+1: Rust client-credentials → 1,420 req/s, p99 = 28ms
                                     ↓ 23% throughput drop, 133% p99 increase
A 23% throughput drop is well outside normal CI runner variance (typically ±5-10%). This warrants investigation.
Ratio stability check
Week N:   Rust/Keycloak ratio = 3.8x throughput
Week N+1: Rust/Keycloak ratio = 2.1x throughput
          Keycloak absolute numbers unchanged
          → Regression is in Rust server code
Latency distribution shifts
Watch for p95/p99 diverging from median. If median stays flat but p99 doubles, you have a new slow path that only triggers under specific conditions — often a cache miss, a new database query, or a lock contention issue.
Error rate as a canary
Any non-zero error rate under light load is a red flag. The thresholds in the k6 scripts enforce this:
thresholds: {
  http_req_duration: ["p(95)<2000", "p(99)<5000"],
  http_req_failed: ["rate<0.05"],
  http_reqs: ["rate>0"],
}
If http_req_failed exceeds 5%, k6 marks the test as failed. Combined with the GitHub Actions failure status, this becomes an automatic regression gate.
🛠️ Adapting This Pattern for Your Projects
The architecture is transferable to any project that has HTTP endpoints worth benchmarking. Here’s what you’d need:
- k6 scenario scripts — one per endpoint or workflow you want to track.
- A Docker Compose file — your server + dependencies with resource limits.
- A planner script — optional but valuable if you have multiple services to benchmark selectively.
- An analysis script — parse k6 JSON output, compute trends, generate reports.
- A GitHub Actions workflow — cron schedule +
workflow_dispatchfor manual runs.
The key insight is that you don’t need a dedicated performance testing infrastructure. GitHub Actions runners are noisy, but they’re consistently noisy. The same runner variance that makes absolute numbers unreliable makes relative trends surprisingly stable.
🏁 Key Takeaways
- Performance testing belongs in CI, not in a pre-release phase. Weekly cadence with smart selection keeps it affordable.
- Trend detection beats point-in-time measurement. A single benchmark number is noise. A trendline over 12 weeks is signal.
- Cross-server comparison is a regression control group. If only your server slowed down, it’s your bug. If everyone slowed down, it’s the environment.
- k6 is an excellent CI-native load testing tool — lightweight, structured output, Docker-friendly, no JVM overhead in the test harness itself.
- Partial runs with baseline reuse make weekly cross-server benchmarks practical without burning hours of CI time.
- Automated issue creation for version bumps closes the loop between “dependency changed” and “someone needs to check performance impact.”
The Weekly Benchmarks workflow and the full benchmark harness are open source. Fork it, adapt the k6 scenarios to your endpoints, and start building your own performance trendline.
References
- rust-oauth2-server — the Rust OAuth2 server project
- k6 Documentation — Grafana k6 load testing framework
- Weekly Benchmarks Workflow — the GitHub Actions workflow discussed in this post
- Keycloak — Java-based identity and access management
- Ory Hydra — Go-based OAuth2 and OpenID Connect server
- Authentik — Python-based identity provider
- node-oidc-provider — Node.js OpenID Connect provider